Adapter Source Stepping
As of version 3.10, the NUnit3TestAdapter NuGet package and VSIX contain source-indexed PDBs for the adapter. Debuggers can step into the source code, set breakpoints, watch variables, etc. It’s easy to drop into NUnit adapter code any time you want to understand what’s going on.
If you’re getting ready to report a bug in the adapter, figuring out how to create a minimal repro is much easier since you aren’t dealing with a black box!
How to step into adapter source in the Visual Studio debugger
The NUnit adapter PDBs are source-linked and work with Visual Studio 2017 or later.
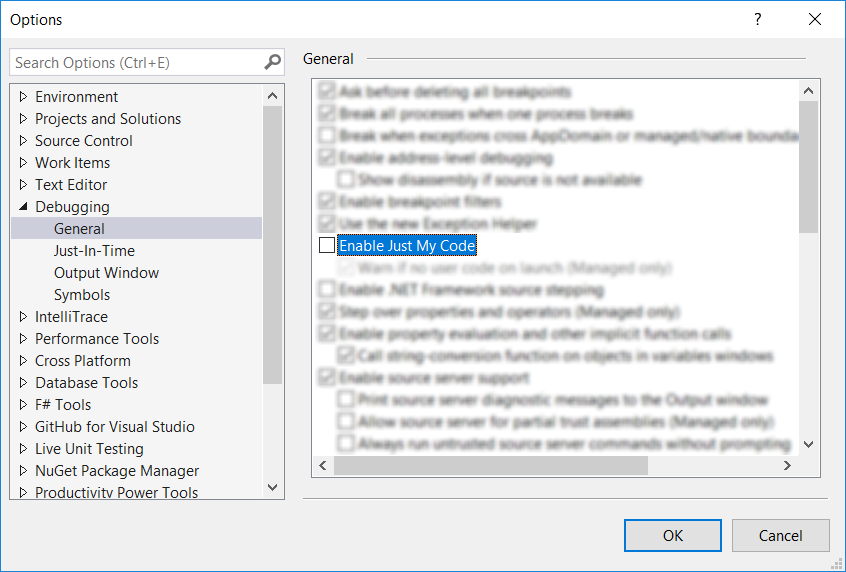
- Turn off Debug > Options > ‘Enable Just My Code.’
Note
This is something you’ll want to leave on and only turn off when you want to step into source that isn’t contained in your solution.

(Next time you can make this faster by installing the excellent extension Just My Code Toggle. This allows you to set a keyboard shortcut along with adding a toolbar button and call stack context menu item.)
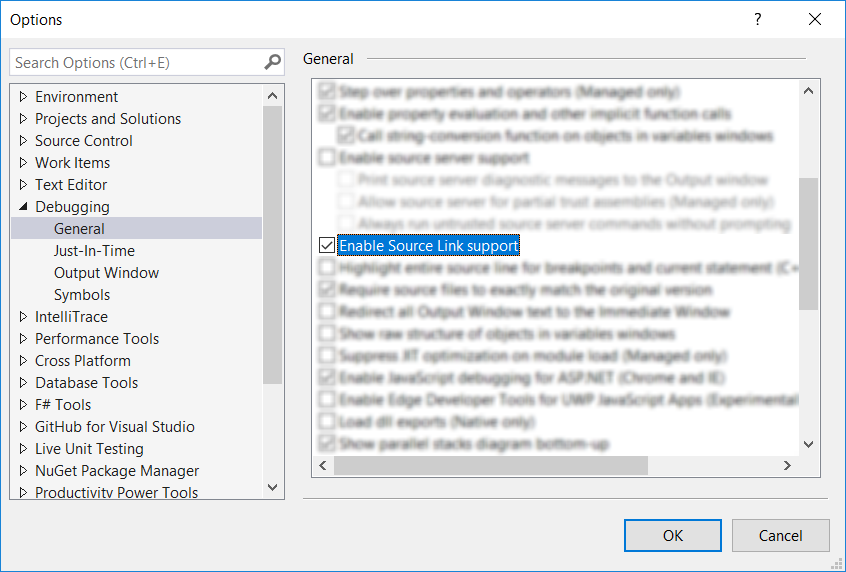
- If needed, turn on Debug > Options > ‘Enable Source Link support.’ This can usually be left on.

- Congratulations! You can now use the debugger to step into method calls to the NUnit adapter and to set breakpoints and watch variables in the source! Keep in mind that it’s still a release build of the adapter, so variables and sequence points may not be available depending on runtime optimizations.